Sierra Chart's [Color Bar Based on Alert Condit...
Sierra Chart's Color Bar Based on Alert Condition study is a powerful little tool we can use for setting up all kinds of chart indicators on a bar-by-bar level.
In this example, I want to print a small dot above bars that are closing within their top third, and below bars closing within the bottom third. This will be accomplished by adding the study twice to the chart, one for bull bars and one for bear bars, then opening the settings for each.
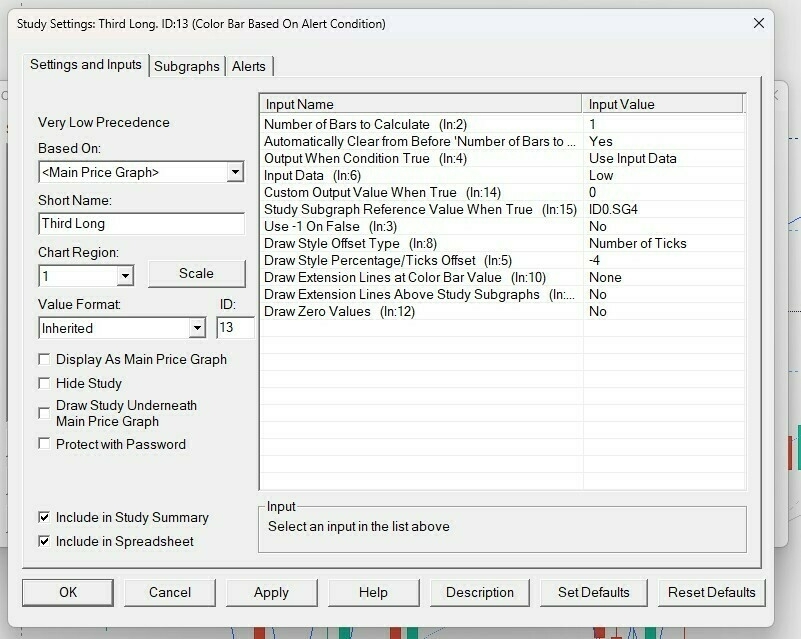
Those are the input values we are interested in:
Number of Bars to Calculate: I have this set to '1', so only the currently live bar shows the indicator. When testing, we should set this to a higher value to check it's working as intended (try the last 30 bars or so).Automatically Clear (etc etc): Set this to 'Yes' to only print the dot on the bars that currently match your alert, and clear the previous ones.Input Data: to print a dot below the bar, we choose 'Low', and to print above the bar, we choose 'High'. We then set an appropriateDraw Style Percentage/Ticks Offsetto determine how far apart from the bar our dot will be. I wanted my dot to print 4 ticks away. If printing above, we use a positive number. If printing below, a negative number.
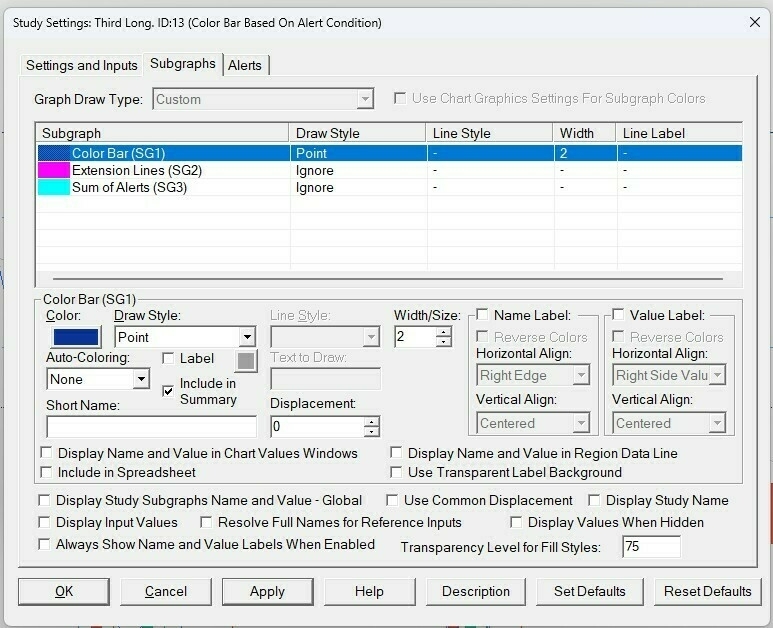
At the bottom of the Subgraphs settings, I have unchecked all the boxes for displaying the study name and values, because I don't want any text information cluttering my screen. I set the Color Bar draw style to 'Point' and pick a color and size that suits my chart. Now on the third tab, Alerts, we write our code and make sure to check the box "Enabled". For testing purposes, enter =1 on the Alert Condition text box and make sure it looks the way we want.
When satisfied, enter the code as needed.
// Closing on top third
=(C-L >= (H-L) * (2 / 3))

// Closing on bottom third
=(C-L <= (H-L) * (1 / 3))
We can add other criteria by using the ADD() function, such as checking that bars close within 4 ticks of the high/low or that they are closing bullish/bearish. Example:
/*
Bar closing on top third, less than 1 point (4 ticks)
away from the high and with a bullish body
*/
=AND(C-L >= (H-L) * (2 / 3), H-C < 1, C > O)