Sierra Chart indicator for strong signal bars
| 3 min read
In price action (as taught by Al Brooks, Mack and Thomas Wade), a good signal bar is one that first moves in one direction before reversing and closing strongly on the opposite direction, trapping traders.
Here's a neat little indicator using Sierra Chart's Color Bar Based on Alert Condition study to print an arrow below such strong signal bars.
This study is NOT indicating buy/sell signals. It is merely indicating signal bars that trapped traders in the opposite direction before reversing strongly. Context is extremely important, and a good signal bar in a terrible context is actually a terrible signal bar (don't get trapped!).
It builds upon the same techniques I used on the indicator for bars closing near their high/low indicator, but this time I will use a 21-bar exponential moving average to filter for bullish bars above and bearish bars below the EMA.
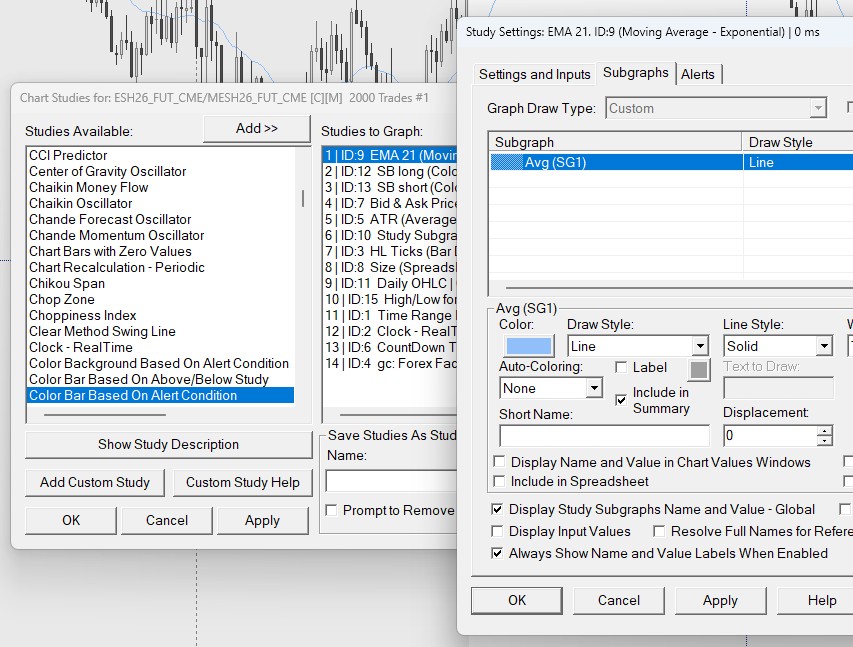
First, add a 21-EMA to the chart, then a "Color Bar Based on Alert Condition" study. Note the ID of the EMA study and of its Subgraph (the actual line that shows up on the chart, and that is calculating the EMA value). In the example above, my EMA has an ID equal to 9 (ID9) and the Subgraph is 1 (SG1).
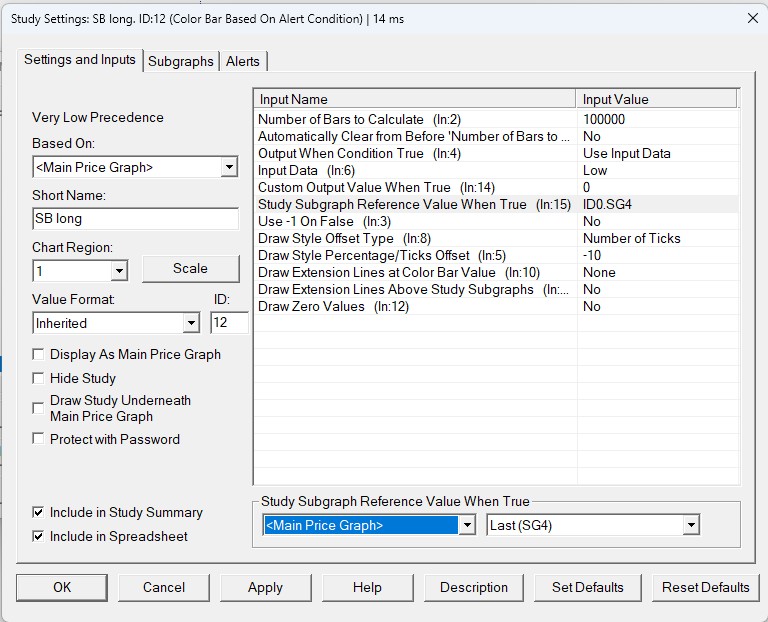
Edit the Settings of the study to determine where the arrow should be placed in the chart. I'm using Input Data: Low and Draw Style Percentage/Ticks Offset: -10 because I want my arrow for bullish signal bars to show up exactly 10 ticks below the low of the bar. To show an arrow 10 ticks above a bearish bar, change those two inputs to Input Data: High and Draw Style Percentage/Ticks Offset: 10.
For Study Subgraph Reference Value When True I selected Main Price Graph > Last, so we calculate our indicator using the bars' closing prices. Your ID and SG numbers might be different from mine, so make sure to click on the value and use the dropdowns to adjust.

The second tab in the study refers to the Subgraph, which is the visible "drawing" that shows up on the chart. I have a green arrow up for the bullish signal bars and a pink arrow down for the bearish signal bars. Everything else is set to hidden.

The last tab in the study is the most crucial one: Alerts. This is where we will write the code that will be evaluated on every bar. It's important to check the Enabled box and it is up to you if you also want to have a sound alert going off whenever the bar meets the alert conditions.
Alert conditions for bullish signal bars:
=AND(C>ID9.SG1,L<L[-1],C>(H-0.75)).
On each bar the study will evaluate if the last closing price (C) is above the 21-ema (ID9.SG1), if the current low (L) is lower than the previous bar's low (L[-1]) (trapping sellers), and if the closing price is greater then the high of the bar minus 3 ticks (H-0.75) (closing near the high). All of the conditions must be true (AND()).
Reverse the logic for bearish signal bars:
=AND(C<ID9.SG1,H>H[-1],C<(L+0.75)).
Here, the alert looks for bars closing below the 21-ema, making a high greater than the previous' bar high (trapping buyers), and with a closing price lower than the low of the bar plus 3 ticks (closing near the low).
 A 2000-tick chart with the signal bar indicator.
Comments